
The S&P 500 spent only a short time below the 20%-decline threshold, before jumping back above it last week. U.S. large-cap stocks rallied 6.5% based on optimism that inflationary pressures are starting to respond to higher interest rates.
Key Points for the Week
- The S&P 500 bounced off recent lows, rallying 6.5% last week.
- Interest rates moved slightly lower as expectations for inflation declined.
- Existing home sales fell 3.4% last month while new home sales jumped 10.7%.
The optimism was partly driven by reassuring consumer expectations for inflation. The University of Michigan consumer sentiment data reported inflation expectations fell from 5.4% to 5.3% for the next year and dropped from 3.3% to 3.1% for the next five years. That data indicates inflation expectations are not becoming as firmly established in the economy as many feared.
Purchasing Manager Index data for goods and services both declined in the U.S., adding support to the idea interest rate increases are slowing activity. Both manufacturing and services data remain above 50, meaning they are expanding. The manufacturing index fell to 52.4 from 57 in May and reached a 23-month low. Services dipped from 53.4 to 51.6, which is the lowest reading in five months.
High home prices and higher financing costs are slowing housing activity. Existing home sales fell 3.4% last month and have fallen 8.6% in the last year. New home sales jumped 10.7% last month but have still fallen 5.9% in the last year. As we note in the next section, home affordability has fallen with higher rates, but sales should benefit from ongoing demographic trends (Figure 1).
Global stocks did not jump as much as U.S. stocks did last week. The MSCI ACWI added 4.8%. The Bloomberg U.S. Aggregate Bond Index surged 0.6% as lower inflation expectations supported bond prices. The Core Personal Consumption Price Deflator will provide additional perspective on inflationary pressures when it is released on Thursday.
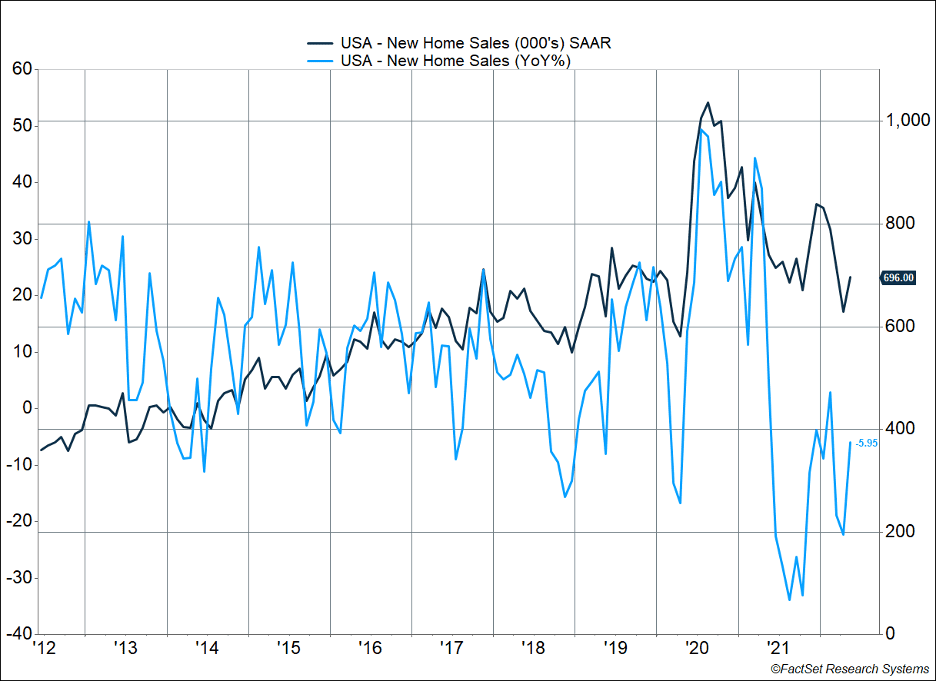
Figure 1
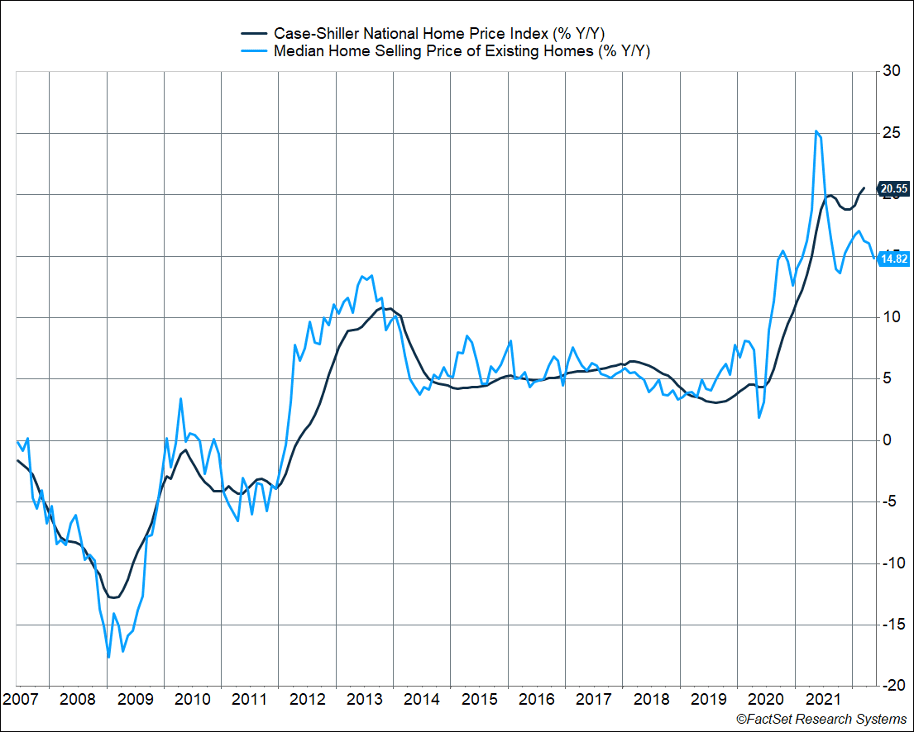
Figure 2
Housing and Interest Rates
People will complain the military is always well-prepared to fight the last war. Investors should be careful who they criticize because we can often act the same way. Some are comparing today’s housing market to the market leading up the Great Recession. The 2008 financial crisis was driven by exorbitant demand for housing and loose lending standards that imperiled many banks. 2022 is a much different market, and in today’s update, we’ll explore some of the important differences.
A recent piece by the home loan buyer Freddie Mac (yes, the one that needed additional government support during the housing crisis) highlights some of the key trends that have caused housing prices to jump so rapidly in recent years (Figure 2) and why higher interest rates may not do as much damage to the housing market as some feared (Figure 1).
The piece cites four factors:
- “Record low mortgage rates in 2020 and 2021 and the race to beat future increases;
- Limited supply from underbuilding and below average distressed sales;
- An increase in first-time homebuyers due to favorable age demographics; and
- Increased migration from high-cost cities to areas that already had a housing shortage.”
When the Federal Reserve cut interest rates in response to the pandemic, homeowners rushed to refinance and homebuyers took advantage of low rates to move. The surge of demand for new homes encountered a housing market with the fewest homes for sale since the statistics inception in 1993. The supply situation was further constrained because pandemic aid shrunk the number of distressed sales. Great for those families, but it also cut off another source of supply. The market would normally respond by building more homes, but rapidly increasing timber prices in the early stage of the pandemic limited supply and slowed the ability to start new projects.
Another powerful force for home demand was the number of millennials at the prime age to purchase their first home. There are more than 46 million 25-34 year-olds in the U.S., about 6.5 million more than in 2006. Given the strong employment market prior to COVID, millennials were in a good position to buy homes. Many millennials still haven’t purchased a home. From 2012 to 2022, the number of renter households ages 25-44 doubled from 1.75 million to 3.5 million, and the trend is still moving higher. Potential demand for housing remains robust.
Another part of this trend was a preference for mid-sized metro areas from the largest markets. Those markets had already experienced increased demand prior to the pandemic, especially in the South and Mountain West.
Other pandemic-related factors fed into these same themes. Moving away from big cities became more attractive as large cities lost some advantages during COVID lockdowns. Working from home increased the demand for larger and remodeled houses, which were more affordable in smaller cities.
The report emphasized the purchase of homes for rent is only a moderate factor in housing demand. Large corporate purchases of homes have increased, but the overall investor share of home sales was 27.6% in December 2021, only 0.9% higher from two years earlier.
Given this environment, how will mortgage rates over 6% affect the market? Our expectation is home price appreciation will slow. Higher rates increase the total cost of a home, and buyer demand should slow down just as cities are starting to reopen. The trend away from the largest cities will likely continue. Demand should stay relatively strong given the demographic trends and as long as there isn’t a deep recession.
For those still thinking about the housing crisis of 2008, there are some important differences. As long as unemployment remains fairly low, foreclosures and short sales should increase only gradually as consumers remain well-positioned to make payments. The average credit score on a new loan is approximately 775 in today’s environment. In the housing crisis the average was closer to 700. Some have noted an increase in the number of homes under construction and compared it to 2008. The difference is many of these homes are already sold and supply chain constraints have prevented their completion. The deep challenges of 2008 seem unlikely given the strength of the market and the financial security of the buyers.
Last month’s 10.7% increase in new home sales, after a recent decline, is a good indication demand remains robust. The net effect should be a slowing market with demographic factors and geographic preferences supporting prices in many areas. Investors in homes or homeowners looking to sell should not expect the rapid price gains of the last couple years to continue. A more likely trend is for price gains to slow toward historical trends, with continued variability based on geographic region.
–
This newsletter was written and produced by CWM, LLC. Content in this material is for general information only and not intended to provide specific advice or recommendations for any individual. All performance referenced is historical and is no guarantee of future results. All indices are unmanaged and may not be invested into directly. The views stated in this letter are not necessarily the opinion of any other named entity and should not be construed directly or indirectly as an offer to buy or sell any securities mentioned herein. Due to volatility within the markets mentioned, opinions are subject to change without notice. Information is based on sources believed to be reliable; however, their accuracy or completeness cannot be guaranteed. Past performance does not guarantee future results.
S&P 500 INDEX
The Standard & Poor’s 500 Index is a capitalization-weighted index of 500 stocks designed to measure performance of the broad domestic economy through changes in the aggregate market value of 500 stocks representing all major industries.
Bloomberg U.S. Aggregate Bond Index
The Bloomberg U.S. Aggregate Bond Index is an index of the U.S. investment-grade fixed-rate bond market, including both government and corporate bonds.
Khater, Sam and Ralph DeFranco. FreddieMac. 6/09/22. https://www.freddiemac.com/research/insight/20220609-what-drove-home-price-growth-and-can-it-continue
Khater, Sam and Kristine Yao. 06/22/22. https://www.freddiemac.com/research/insight/20220622-pursuit-affordable-housing-migration-homebuyers-within-us-and-after-pandemic
University of Michigan Consumer Sentiment 06/22. http://www.sca.isr.umich.edu/
S&P Global 06/23/22. https://www.pmi.spglobal.com/Public/Home/PressRelease/8fd15c4803fd4399bea8d16e1dc06422#:~:text=S%26P%20Global%20Flash%20US%20Services,slowdown%20and%20only%20modest%20overall
Census Bureau. 06/24/22.3 https://www.census.gov/construction/nrs/pdf/newressales.pdf
New York Fed 05/22. https://www.newyorkfed.org/medialibrary/interactives/householdcredit/data/pdf/hhdc_2022q1.pdf
Compliance Case #01413571
